Project Z1
Z1 An integrated data platform on adaptation of Staphylococcus aureus
This project will apply data management, presentation and visualization with the aim of providing a unified S. aureus platform (AureoView) for public accessibility of available data and knowledge. Project goals will be accomplished by: (i) complementing and extending the AureoWiki by e.g. regulatory information, pathway maps, and gene expression data, (ii) integration of the information from all topic-specific databanks and inclusion of data generated in infection-related settings and (iii) utilization of new visualization techniques for the dissemination of data, e.g. augmented web-based presentation of S.aureus models.
(German version) Z1 Eine integrierte Datenplattform über die Anpassung von Staphylococcus aureus
Dieses Projekt wird Datenmanagement, Datenpräsentation und Visualisierung verbinden, um eine integrierte Datenplattform (AureoView) von S.aureus zu erzielen, die öffentlich alles Wissen und alle Daten über S.aureus zur Verfügung stellt. Die Projektziele werden erreicht durch (i) Komplettierung und Ergänzung des AureoWiki durch Information zu Regulation, Stoffwechsel und Genexpression, (ii) Integration aller Informationen aus themenbezogenen S.aureus Datenbanken unter Einbeziehung von infektionsbezogenen Daten und (iii) Nutzung neuer Visualisierungstechniken für die Verbreitung der Daten, z.B. verbesserte Web-basierte Präsentation von S.aureus Modellen.
Staphylococcus aureus genomic, transcriptomic, proteomic and metabolomic data deliver complementary information about different aspects of the adaptation potential of this pathogen to the host. An integrated view of S. aureus profits from bioinformatics approaches for the integration of data collected experimentally and from literature using modern tools such as graphical presentation and wiki technology.
This project will perform data management, presentation and visualization with the aim of providing a unified platform (AureoView) for public accessibility of available data and knowledge. Project goals will be accomplished by: (i) integration and visualization of the multidimensional information from all general and topic-specific databases by B-fabric, including data generated in infection settings, (ii) developing the AureoWiki further by implementing regulatory and functional information, pathway maps, and gene expression data, and (iii) utilization of new visualization techniques for the dissemination of data, e.g., augmented web-based presentation of network models achieved in the CRC-TRR34. This project provides a novel, integrated means of presenting the adaptation potential of pathogenic S. aureus to environmental stimuli, including host challenges, in graphic and open science repository formats.
Report and state of understanding
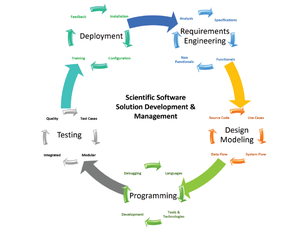
Functional genomics data are an important complementation of genomic data. Integrated repositories of genomic and post-genomic data are becoming increasingly important . The multidimensional aspects of these data, including the rich transcriptome , require multidimensional representation. To further this end, new ways of presentation must cope with increasing masses of data and meet the requirements for proper annotation and user-friendly presentation. A good example is the ENCODE (Encyclopedia of DNA elements) consortium with the ENCODE project portal, which combines journal articles, genome views and large-scale data presentation . Furthermore, wiki technology as a concerted, user-centered effort to curate and collate information has acquired momentum, best demonstrated by the stunning success of Wikipedia (Wikimedia Foundation, Florida, USA) since 2003. The prokaryotic scientific community can also name important examples, for instance SubtiWiki and EcoliWiki.net. Different modules are integrated to yield optimal presentation and user friendliness . For S. aureus, we want to create a novel form of presentation, AureoView, inspired by these current trends and convincing examples.
Data management and rapid data comparison: Our backbone for the management and analysis of omics data from different molecular levels started in the 2nd period with the Protecs database . Protecs allows efficient storage of multidimensional data such as proteome, transcriptome and metabolome data. At the start of the current funding period we illustrated the functionality of Protecs in the context of studying the adaptation of S. aureus to anaerobic conditions. However, as large-scale data sets rapidly increase, we can and have to deal now with very complex data sets and rapidly changing conditions as shown for environmental proteomics data (11). Hence, we are now switching to B-Fabric as a powerful and versatile basis as master management system for integrated data management.
To deal in particular with regulatory interactions, different topic-specific databanks were established. Two component systems in S. aureus (YycF/YycG and AgrC/AgrA) were compared and various sequences collected with the aim to provide the user with an overview on the evolution of such regulatory systems with broad alignments as well as close up looks on involved protein structures (8). The GoSynthetic database in turn offers a more general view onto the effects of regulatory switches and their influence on the network. Here, we included detailed hierarchical protein-protein interaction networks in S. aureus and compared these to other organisms (9). This is also preparatory work for the augmented webtools we want to deliver in the next period: In GoSynthetic the user can: i) rapidly navigate between different networks, ii) ask questions with auto-completion function, iii) choose between different views on the network and iv) export networks with cytoscape and analyze (or annotate) them further. There are different presentations for summary information on interaction networks and the user can always follow a function-guided vocabulary (according to gene ontology or according to engineering terms) to modify the network (either for planning generation of new mutants or to understand network function).
Innovative and novel visualization: Data visualization was constantly developed further by refining tools such as Voronoi Treemaps. Regarding the latter, we tested different tessellations as well as classifications according to different terms (TIGR fam, gene ontology) and enhanced the sensitivity to detect subtle changes in functional clusters applying multilevel classification. Furthermore, the total genome viewer “activeGenes” for the display of PCR and tiling array expression data, Streamgraphs for the integrated display of gene functional and time line related expression data and PathwayMaps for the integration of at least two different levels of omics data (transcriptome and proteome / proteome and metabolome) have been developed.
These tools did not only visualize functional changes during adaptation of S. aureus to different environmental stimuli, but in many instances only the graphical representation in a two dimensional plane made changes in functional clusters apparent as they would have been overlooked by analyzing just gene expression data or pathway fluxes . In an ongoing study this was extended from analyzing the effects of vancomycin treatment (10) to the test of the mode of action of new antibiotic lead compounds. We could clearly show, that some changes were only apparent from the functional protein cluster changes readily visualized by our Voronoi Treemaps (Fig. 1), others become apparent from gene expression changes (already visible in Protecs expression viewer (7,11)). However, other changes, particularly in metabolism and metabolic flow, become only apparent if the metabolic flow and pathways are properly presented. Our data indicate that for S. aureus changes in flux strength are also quite important in adaptation, e.g. to glucose limitation (14) as well as xenobiotics (18). However, such facets of adaptation are only revealed by appropriate visualization of metabolic fluxes and networks. A whole suite of such visualization programs were developed, using as databases different omics data sets, calculating potentially as well as actually active pathways and fluxes (YANA, YANAsquare, YANAvergence). Recent versions of these tools were applied in modeling antibiotic and cytotoxic effects of the dimeric isoquinoline IQ-143 (18) as well as for predicting appropriate choices for different labeling experiments (13,15).
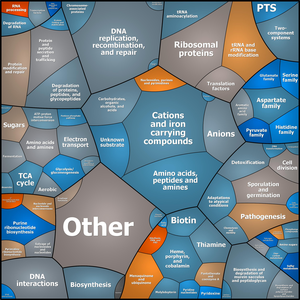
Figure1. Functional clusters of regulated metabolic networks are visualized by Voronoi tree maps.
Gene expression changes of S.aureus COL after administration of IQ-143 (Twofold excess of the minimal inhibitory concentration) are indicated. Functional clusters displayed in light-blue or brownish colours represent down- and up-regulation, respectively. A first level classification according to TIGR families is shown in Voronoi tessellations. The tessellations reveal in several instances changes for functional clusters not apparent from alternative analyses of the gene expression data (18).
Furthermore, comparative databanks revealed adaptation reactions with transcriptome and proteome information and regulatory networks on evolution and adaptation in S. aureus and visualization methods allowed rapid zooming in to examine the changes detected.
Visualization tools such as Voronoi Treemaps can also be applied for the benchmarking and comparative analysis of the data quality of different protocols such as e.g., the recovery rate of peptides from a selected array of S. aureus samples by different protein extraction protocols. This visualization allowed a detailed perspective of the data (about 200 000 peptides) never reached before (see Figure 2, Depke and Schmidt, unpublished data).
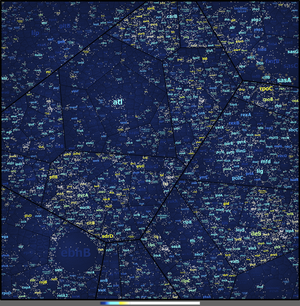
Fig 2. Tiles on the deepest treemap level represent theoretically calculated tryptic peptides of the S. aureus proteins. The coloring scheme of the protein labels represents relative sequence coverage according to detected peptides (dark blue means no coverage via cyan and yellow to white indicating coverage on peptide level >30%). Proteins of similar cellular functions are displayed in close proximity. White tiles represent detected, dark blue tiles theoretically possible but undetected tryptic peptides.
Dissemination of data, access and wiki technology: Access to the different data sources and all available knowledge about an organism in a comprehensive and clearly presented form is pivotal for the interpretation of experimental data, in particular from genome-scale experiments. First routes to dissemination of data are congresses with associated workshops and demonstrations. For instance our latest visualization tools were presented on the international meeting for visualizing biological data (VizBi) 2012, 2013 and 2014 conferences. Furthermore, the wiki-type database AureoWiki was established to make the wealth of information on S. aureus available to both CRC-TRR34 members and external users, as well as to facilitate the contribution of community expertise, profiting not only from Mäder’s experience with the comprehensive community resource SubtiWiki for the Gram-positive model organism Bacillus subtilis but also from an analysis of the semantic web . In this study we analyzed the large-scale advantages of ontology-specific languages which will contribute to further development of AureoWiki.
The current version of AureoWiki centers on the genes/gene products of three widely used S. aureus model strains (COL, N315 and HG001, a derivative of NCTC 8325). In ongoing efforts this version will be extended to include the 32 published and fully annotated genomes as well as information on the S. aureus pangenome. AureoWiki represents an essential basis for further developments aiming at a unified platform for the presentation of the different aspects of S. aureus physiology, e.g., including metabolic pathways and transcriptional regulation. Furthermore, the comparative database tool GoSynthetic – which presents S. aureus and other model organisms in terms of biological processes and functional categories – allows the user to plan strain-design experiments .
Reference
1. Marx V. 2013. Biology: The big challenges of big data. Nature 498:255-260.
2. Nicolas P, Mader U, Dervyn E, Rochat T, Leduc A, Pigeonneau N, Bidnenko E, Marchadier E, Hoebeke M, Aymerich S, Becher D, Bisicchia P, Botella E, Delumeau O, Doherty G, Denham EL, Fogg MJ, Fromion V, Goelzer A, Hansen A, Hartig E, Harwood CR, Homuth G, Jarmer H, Jules M, Klipp E, Le Chat L, Lecointe F, Lewis P, Liebermeister W, March A, Mars RA, Nannapaneni P, Noone D, Pohl S, Rinn B, Rugheimer F, Sappa PK, Samson F, Schaffer M, Schwikowski B, Steil L, Stulke J, Wiegert T, Devine KM, Wilkinson AJ, van Dijl JM, Hecker M, Völker U, Bessieres P, Noirot P. 2012. Condition-dependent transcriptome reveals high-level regulatory architecture in Bacillus subtilis. Science 335:1103-1106.
3. Mader U, Nicolas P, Richard H, Bessieres P, Aymerich S. 2011. Comprehensive identification and quantification of microbial transcriptomes by genome-wide unbiased methods. Curr Opin Biotechnol 22:32-41.
4. Qu H, Fang X. 2013. A brief review on the Human Encyclopedia of DNA Elements (ENCODE) project. Genomics Proteomics Bioinformatics 11:135-141.
5. Mader U, Schmeisky AG, Florez LA, Stulke J. 2012. SubtiWiki--a comprehensive community resource for the model organism Bacillus subtilis. Nucleic Acids Res 40:D1278-1287.
6. Lammers CR, Florez LA, Schmeisky AG, Roppel SF, Mader U, Hamoen L, Stulke J. 2010. Connecting parts with processes: SubtiWiki and SubtiPathways integrate gene and pathway annotation for Bacillus subtilis. Microbiology 156:849-859.
7. Fuchs S, Mehlan H, Kusch H, Teumer A, Zuhlke D, Berth M, Wolf C, Dandekar T, Hecker M, Engelmann S, Bernhardt J. 2010. Protecs, a comprehensive and powerful storage and analysis system for OMICS data, applied for profiling the anaerobiosis response of Staphylococcus aureus COL. Proteomics 10:2982-3000.
8. Krueger B, Friedrich T, Forster F, Bernhardt J, Gross R, Dandekar T. 2012. Different evolutionary modifications as a guide to rewire two-component systems. Bioinform Biol Insights 6:97-128.
9. Liang C, Kruger B, Dandekar T. 2013. GoSynthetic database tool to analyse natural and engineered molecular processes. Database (Oxford) 2013:bat043.
10. Hessling B, Bonn F, Otto A, Herbst FA, Rappen GM, Bernhardt J, Hecker M, Becher D. 2013. Global proteome analysis of vancomycin stress in Staphylococcus aureus. Int J Med Microbiol 303:624-634.
11. Mehlan H, Schmidt F, Weiss S, Schuler J, Fuchs S, Riedel K, Bernhardt J. 2013. Data visualization in environmental proteomics. Proteomics 13:2805-2821.
12. Dandekar T, Fieselmann A, Majeed S, Ahmed Z. 2012. Software applications toward quantitative metabolic flux analysis and modeling. Brief Bioinform. Nov 9. [Epub ahead of print] doi: 10.1093/bib/bbs065. PMID: 23142828
13. Ahmed Z, Zeeshan S, Huber C, Hensel M, Schomburg D, Munch R, Eisenreich W, Dandekar T. 2013. Software LS-MIDA for efficient mass isotopomer distribution analysis in metabolic modelling. BMC Bioinformatics 14:218.
14. Liebeke M, Dorries K, Zühlke D, Bernhardt J, Fuchs S, Pane-Farre J, Engelmann S, Völker U, Bode R, Dandekar T, Lindequist U, Hecker M, Lalk M. 2011. A metabolomics and proteomics study of the adaptation of Staphylococcus aureus to glucose starvation. Mol Biosyst 7:1241-1253.
15. Ahmed Z, Saman M, Dandekar T. 2012. Formal UML modelling of isotopo, bioinformatical software for mass isotopomers distribution analysis. Software Engineering Journal, SAP Publishing 2:147-159.
16. Turker C, Akal F, Schlapbach R. 2011. Life sciences data and application integration with B-fabric. J Integr Bioinform 8:159.
17. Fuchs S, Zuhlke D, Pane-Farre J, Kusch H, Wolf C, Reiss S, Binh le TN, Albrecht D, Riedel K, Hecker M, Engelmann S. 2013. Aureolib - a proteome signature library: towards an understanding of Staphylococcus aureus pathophysiology. PLoS One 8:e70669.
18. Cecil A, Rikanovic C, Ohlsen K, Liang C, Bernhardt J, Oelschlaeger TA, Gulder T, Bringmann G, Holzgrabe U, Unger M, Dandekar T. 2011. Modeling antibiotic and cytotoxic effects of the dimeric isoquinoline IQ-143 on metabolism and its regulation in Staphylococcus aureus, Staphylococcus epidermidis and human cells. Genome Biol 12:R24.
19. Liang C, Wolz C, Herbert S, Bernhardt J, Engelmann S, Hecker M, Götz F, Dandekar T. 2009. GENOVA: A rapid genome vizualization and functional genomics software applied to strain comparisons in Staphylococcus aureus. . OJB - Online Journal of Bioinformatics 10:201-217.
20. Michalik S, Bernhardt J, Otto A, Moche M, Becher D, Meyer H, Lalk M, Schurmann C, Schluter R, Kock H, Gerth U, Hecker M. 2012. Life and death of proteins: a case study of glucose-starved Staphylococcus aureus. Mol Cell Proteomics 11:558-570.
21. Liang C, Dandekar T. 2006. inGeno--an integrated genome and ortholog viewer for improved genome to genome comparisons. BMC Bioinformatics 7:461.